
Understand
Your collection, quantified.
The Stats dashboard mirrors what's in the vault — value, categories, coverage, and where it all comes from. Stats is part of FossilVault Pro.
 Available on iOS
 Available on Android
Value & mix
What it's worth, what you've spent.
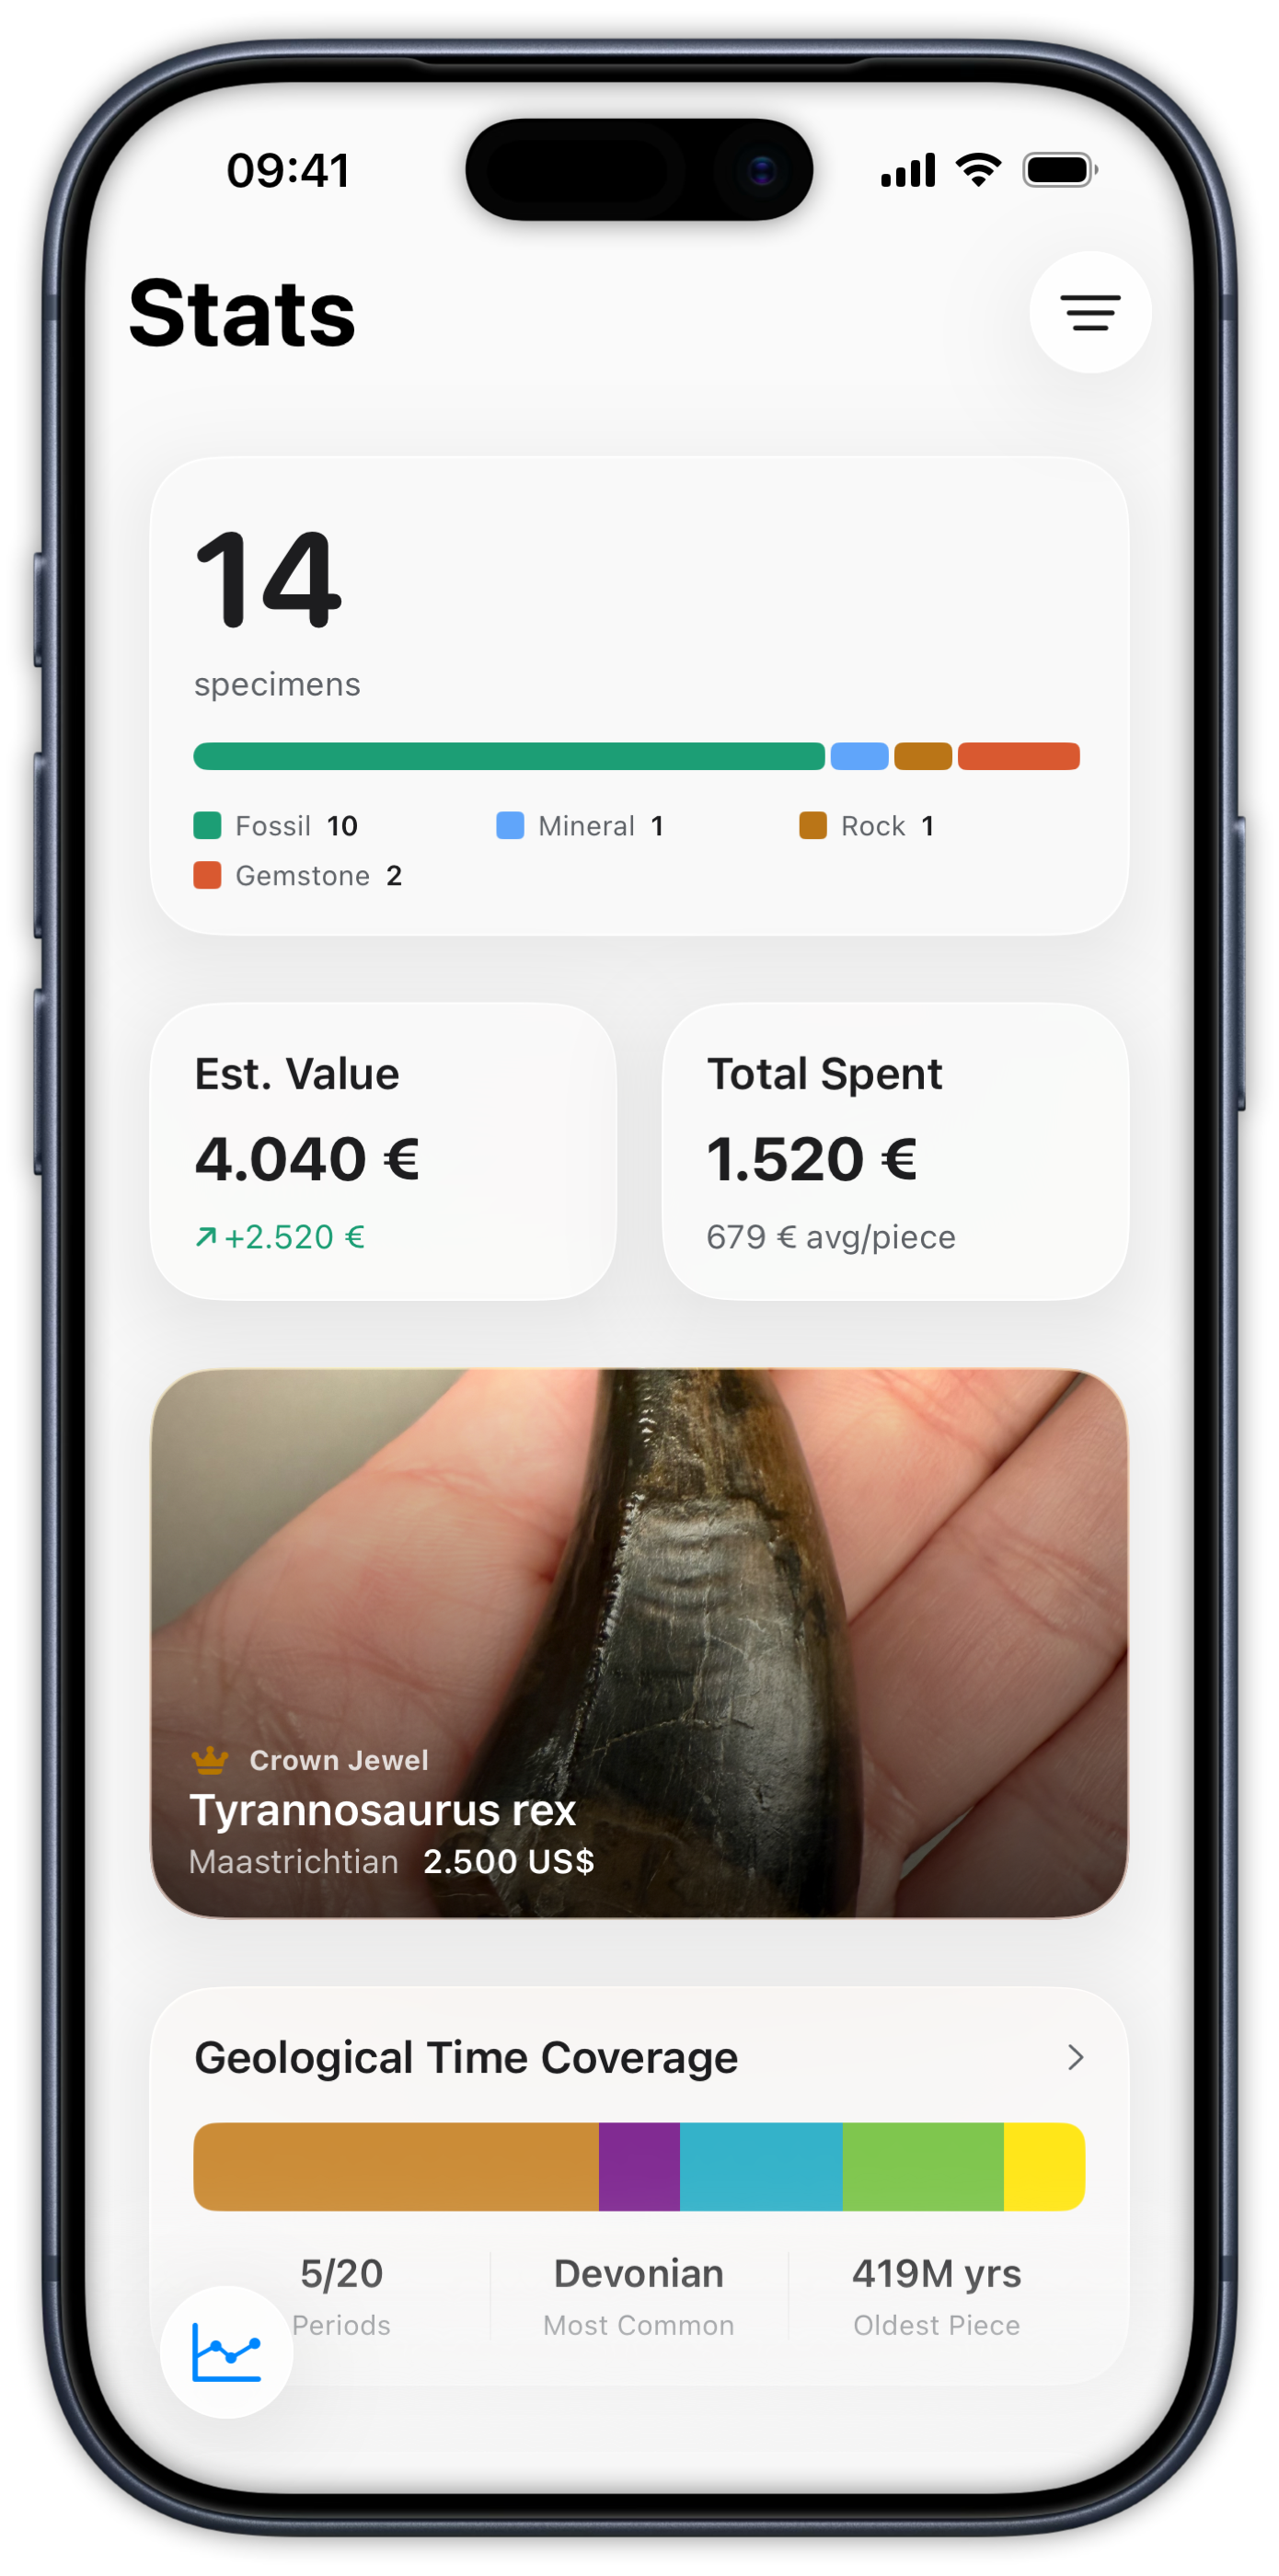
Estimated value and total spent side by side — multi-currency aware — with average per piece, your most valuable pieces, and the crown jewel of the collection. The category bar shows the fossil/mineral/gemstone/rock mix at a glance.
- Est. value vs total spent, value change
- Multi-currency: values roll up across 29 currencies
- Crown jewel & most-valuable list
- Geological time coverage: periods represented, oldest piece
Reach & activity
Where it comes from, how it grows.
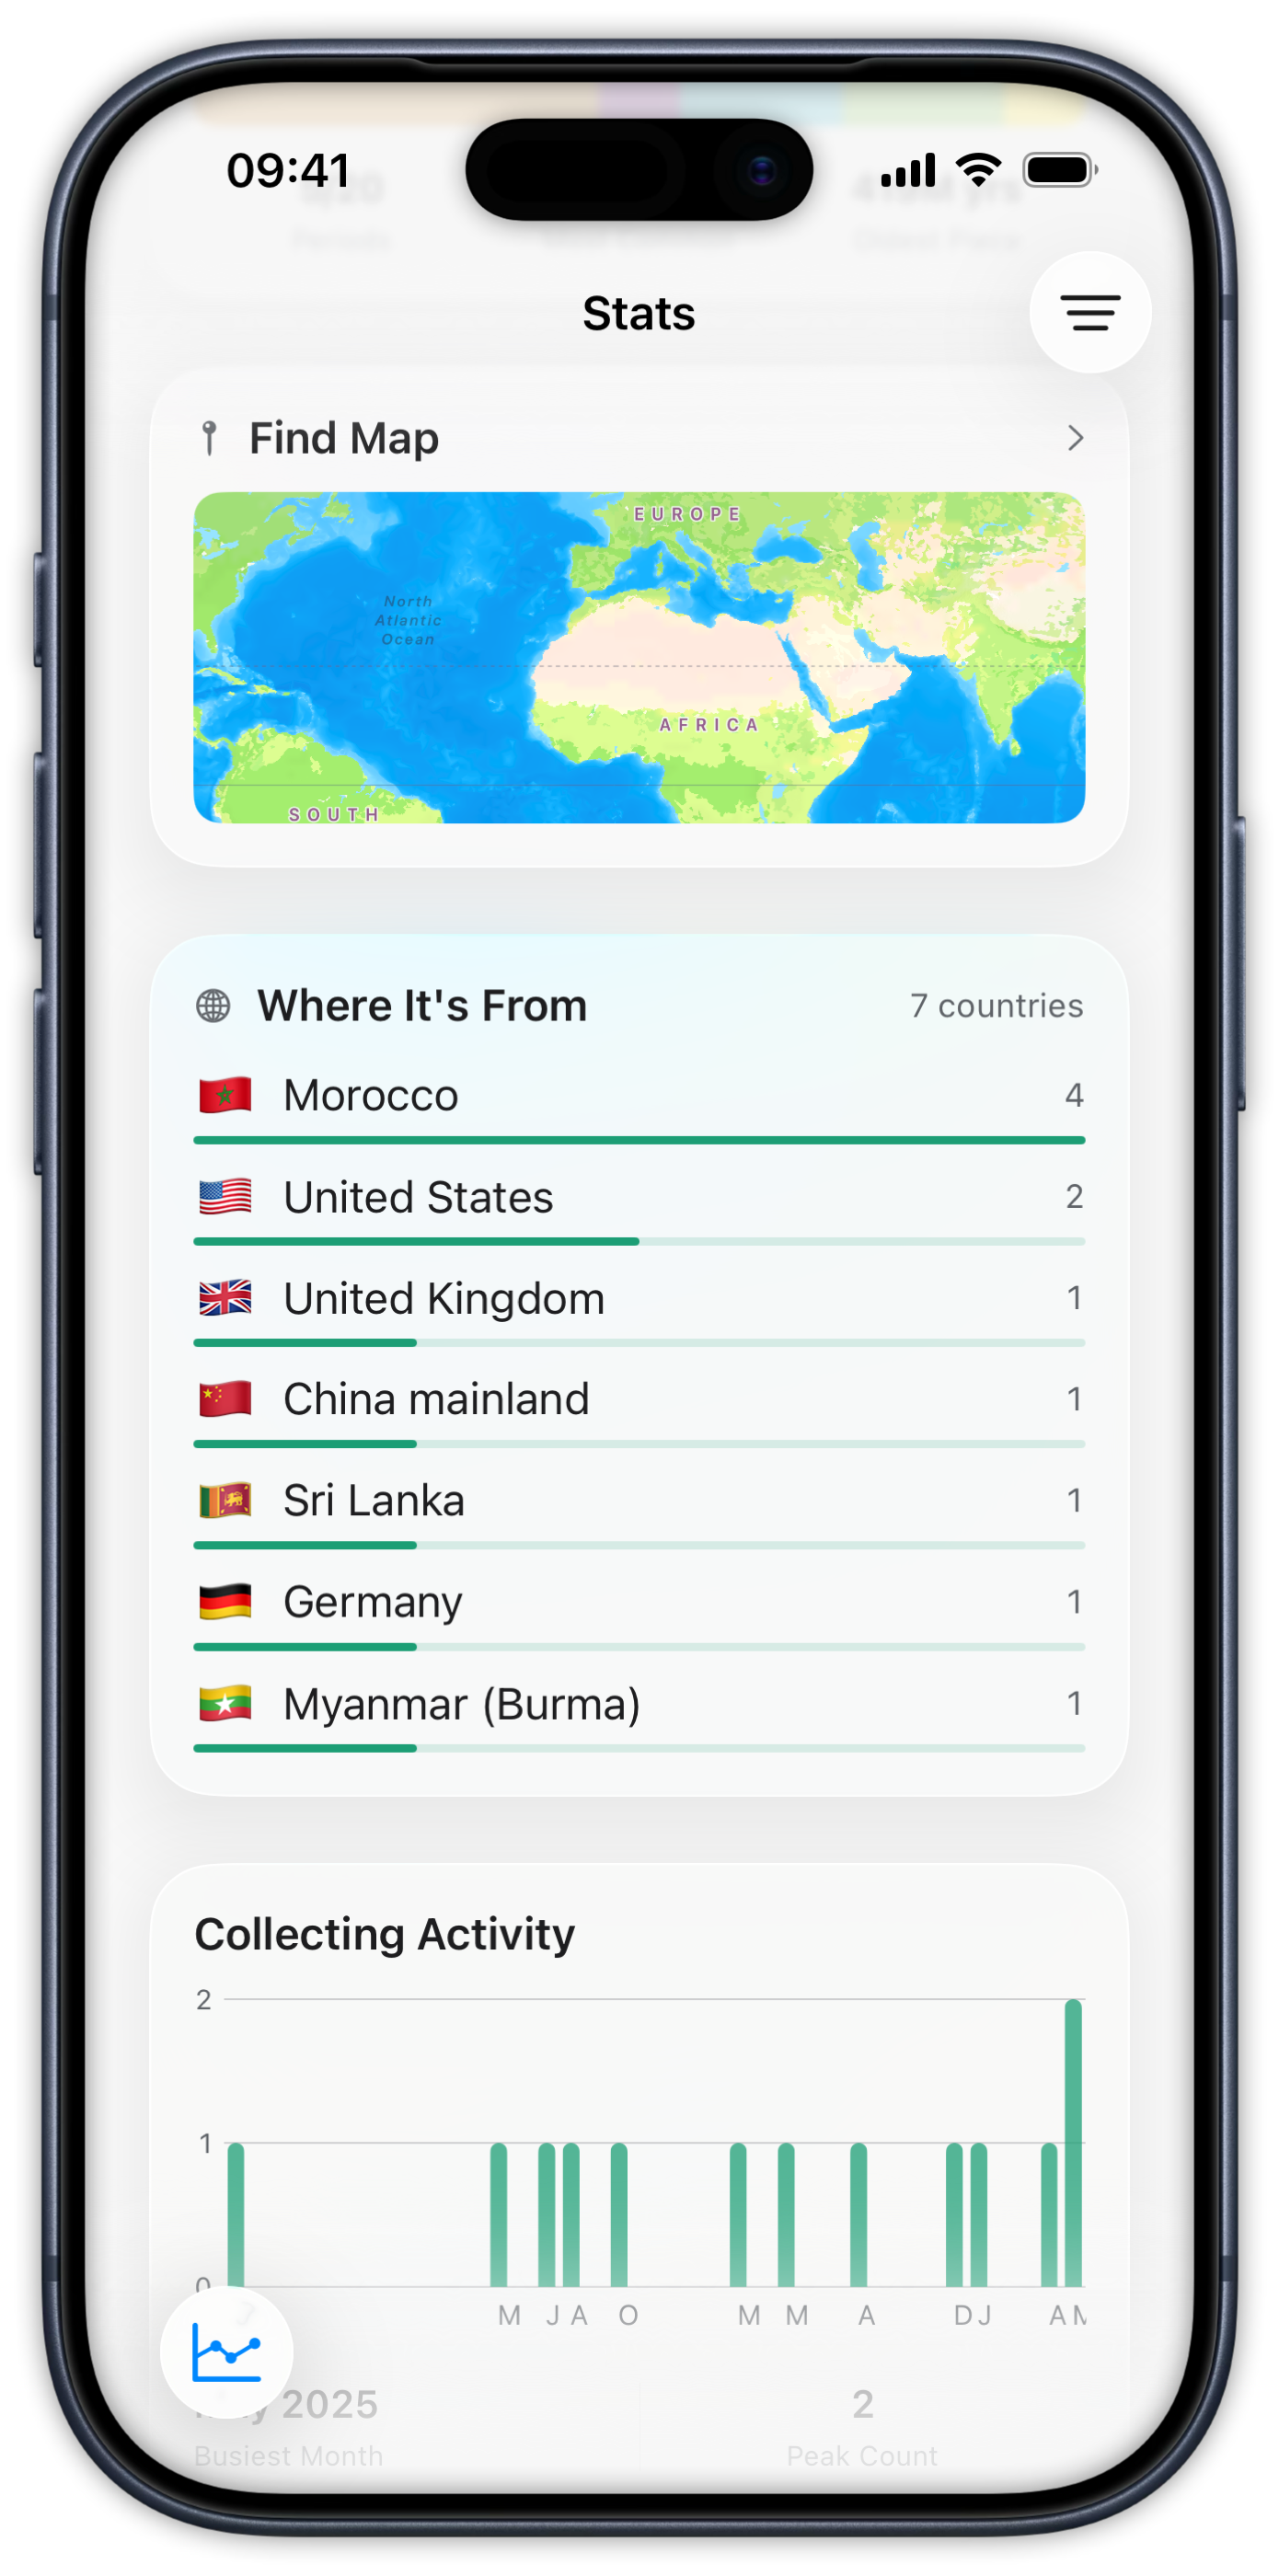
A world map of specimen origins, the country breakdown, and your collecting activity over the years — plus milestones from first acquisition to your thousandth specimen.
- Find map & country breakdown
- Collecting activity by month and year
- Milestones: collection size, deep time, widest reach
Ready for your next specimen.
Free to start on iOS and Android.
 Available on iOSAvailable on Android